| Page |
|
© Peter Broadfoot 2008
Histograms
Introduction to Histograms
Continuous Data
It is fair to say and it may be an understatement: histograms can be confusing. To avoid
initial confusion, we’ll start by describing a histogram, instead of explaining in detail.
A histogram is a frequency diagram and is similar to a quantitative bar chart. In the
simpler type of histogram that we will look at first, the vertical y-axis shows the frequency,
just like a bar chart. The x-axis is a numerical scale with equally spaced divisions. The
example histogram below has an x-axis from 0 to 14miles. A histogram is used for
continuous data, such as length, time and weight. Therefore the x-scale is continuous.
Continuous data cannot be represented on a bar chart. The choice of scale divisions, as with
any graph, depends on the data range. In this example 1mile was chosen. For a smaller
range, such as 0 to 5miles, you could use half-mile divisions on the x-axis.
The bars on a histogram are drawn touching each other – shown in the example histogram.
The bars touch because the data are continuous. There are no gaps between the data’s
possible values and so there are no gaps between the bars. Compare this with a bar chart –
where the gaps remind us that the data are discrete. The bars on a histogram are often
called rectangles. An important thing about histograms is that the data are grouped. To
represent continuous data on a chart, the data must be grouped, explained on the next page.
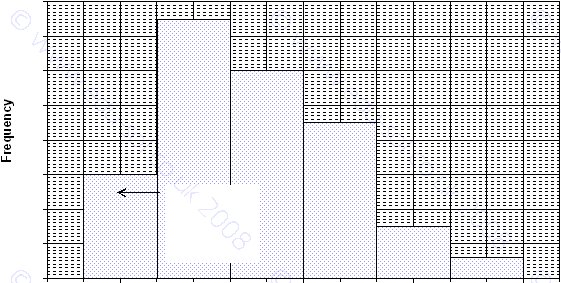
Example of a Histogram
This is the main example of a histogram used throughout this booklet. The x-axis shows
the distance employees travel to work. The frequency is the number of employees. No one
travels less than 1mile or more than 13miles – the range is from 1 to 13miles.
The group of sixty people, who travel from 1mile up to 3miles, is represented by a rectangle
that is 2miles wide and 60 people high. The vertical sides of the rectangle line up with
1mile and 3miles on the x-axis. The next group extends from 3 to 5miles. This is explained
fully in the section on Grouping (next page).
Distances Travelled to Work
0
20
40
60
80
100
120
140
160
0
1
2
3
4
5
6
7
8
9
10
11
12
13
14
Distances Travelled (miles)
This bar means
that 60 people
travel between
1 and 3 miles