| Page |
|
© Peter Broadfoot 2008
Histograms
Answers to Exercises
Exercise 1 – Grouping a Continuous Variable
Class Interval
Class Interval
Values of x
f
90
90 ≤ x < 100
90, 97
2
100
100 ≤ x < 110
104
1
110
110 ≤ x < 120
113, 119
2
120
120 ≤ x < 130
120, 123, 125
3
Exercise 2 – Histogram
Times Taken to Run a Race
Time t
(minutes)
7≤t<8
8≤t<9
9≤t<10
10≤t<11
11≤t<12
12≤t<13
13≤t<14
Frequency
3
5
4
3
6
2
1
Mid-point
(minutes)
7.5
8.5
9.5
10.5
11.5
12.5
13.5
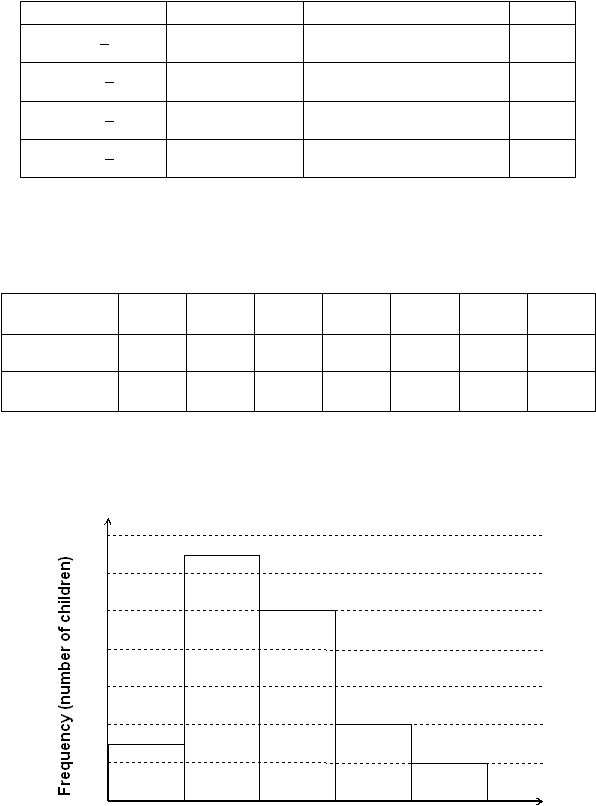
Exercise 3 – Draw a Histogram
Histogram of Weights of Children
This frequency diagram is based on the table of data given in the question.
20
25
30
35
40
45
10
20
30
40
50
60
70
Weight of Children (kg)
0