| Page |
|
© Peter Broadfoot 2008
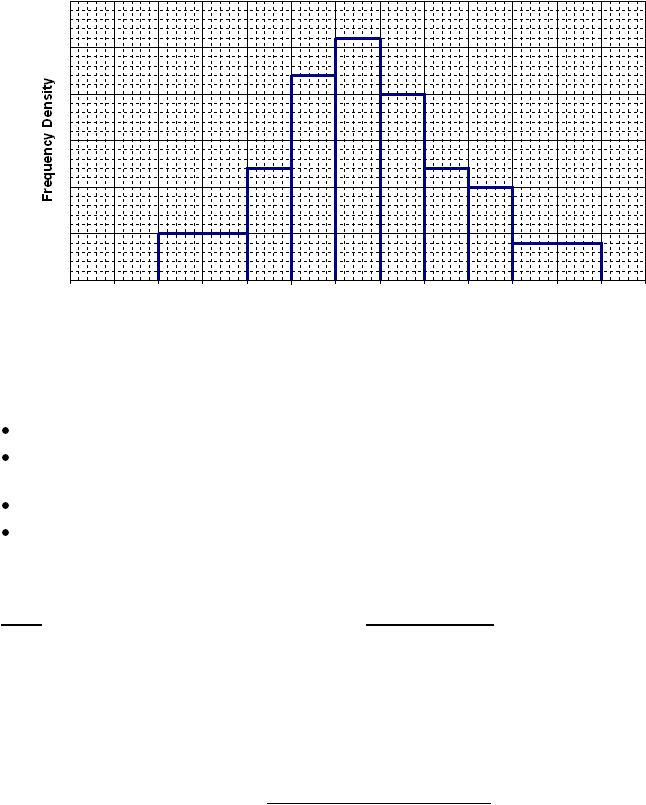
Histograms
Birth Weights
0
0.5
1
1.5
2
2.5
3
3.5
4
4.5
5
5.5
6
6.5
Weight / kg
Sample Exam Question – Histogram
The question is based on the AQA GCSE Maths Module 1 Higher, March 2007, Section B,
question 10.
The question is typical of the Higher paper. You are given a completed histogram. It is
likely, as in this case, that the y-axis has no scale.
The histogram represents the weights of 60 babies and 6 babies weigh from 4 to 4.5kg.
Calculate the number of babies weighing less than 3kg.
Things to notice about this question:
The class width (the width of the bars) is not constant.
The y-axis is labelled Frequency Density. The question will test your understanding of
the link between frequency density and frequency.
There is no scale on the y-axis.
Of the alternative solutions below, candidates generally prefer the ‘areas’ method.
Solution
Either use areas or frequency density.
Areas 6 babies so:
Frequency from 4 to 4.5kg = 6.
From 4 to 4.5kg = 2.4 squares.
Frequency (f) is proportional to number
of squares. 6 babies = 2.4 squares.
Therefore 6/2.4 = 2.5 babies per square.
1 to 3kg is 2+2.4+4.4 = 8.8 squares.
Babies from 1 to 3kg = 8.8×2.5= 22.
Frequency Density 6 babies so:
Frequency from 4 to 4.5kg = 6.
Frequency density = f/w. Width is
0.5kg so fd = 6/0.5 = 12 (height of bar)
First 3 bars, from 1 to 3kg. Heights are 5, 12, 22.
The frequencies are (f=fd×w)
5×1=5, 12×0.5=6, 22×0.5=11.
Babies from 1 to 3kg = 5+6+11 = 22.
Answer: 22 babies weigh less than 3kg