© Peter Broadfoot 2008
Histograms
Frequency Polygons
Introduction
A frequency polygon is a frequency diagram of grouped data and is an alternative to a
histogram. The bars of the histogram are replaced by straight lines joining the mid-points.
We will use the earlier histogram, ‘Times for a Race’, as an example.
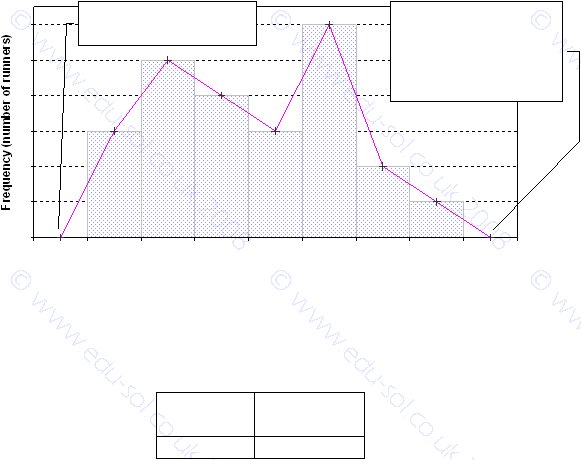
The diagram below shows the histogram and the frequency polygon combined. The mid-
points are plotted, shown by a + . The first point is plotted at t = 7.5minutes, f = 3, half way
between the class boundary divisions at 7 and 8minutes. The next point is at 8.5minutes.
In a question to draw a frequency polygon you are not expected to include the histogram.
When you have plotted the points, don’t forget to join them with straight lines. Take care to
plot the mid-points correctly. You will be given a frequency table listing the frequencies
and the class intervals. For example, here’s part of the table for ‘Times for a Race’:
Time t
(minutes)
Frequency
f
10 ≤ t < 11
3
Some students mistakenly plot the frequency against one of the class boundaries (10 or 11).
You must work out each mid-point. The mid-point of the 10 ≤ t < 11 class is between 10
and 11, at 10.5minutes, and so the point is plotted at t = 10.5minutes and f = 3.
It is conventional on a frequency polygon to extend the polygon by one class interval
beyond the first and last mid-points, so that the graph touches the x-axis. In the graph
above, a line from the mid-point at t = 7.5minutes is drawn one class interval (in this
example 1minute) to the left, to hit the axis at t = 6.5minutes. The polygon is the shape
formed by the line of the x-axis below and the straight lines of the graph above.
In an exam question you may be given a table of grouped data and asked to draw a
frequency diagram. You can choose to draw a frequency polygon or a histogram. Most
people find it easier to draw a frequency polygon.
Histogram - Times for a Race
0
1
2
3
4
5
6
6
7
8
9
10
11
12
13
14
15
Time (minutes)
Note: it is standard
practice to extend the
line by 1 class interval
beyond the first and last
mid-points
The line is extended here
to time=6.5 minutes