| Page |
|
© Peter Broadfoot 2008
Histograms
Exercise 1 – Grouping a Continuous Variable
Here are eight values of the continuous variable x. Copy and complete the table below.
Complete the class interval in the second column in the form 90 ≤ x < 100. Complete the x
column by placing each value in its correct group. Complete the frequency f column for
each class.
113
125
97
123
104
119
90
120
Class Interval
Class Interval
Values of x
f
90
90 ≤ x < 100
90, 97
2
100
110
120
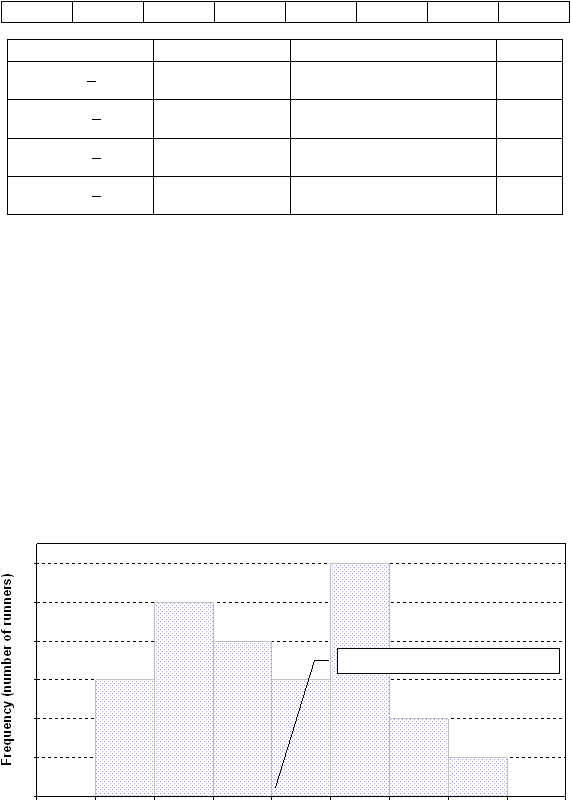
Exercise 2 – Histogram
In the example histogram on page 4, the distance travelled is represented by the letter d. In
another example we might have a variable h for height or W for weight or a general
variable x. The histogram below is about the times taken to run a race, from 7 to 14
minutes. The time is represented by t. There are 24 runners.
There is no point in starting the time-axis (the x-axis) at zero, because the fastest time is
7minutes. The data are grouped into 1minute widths, giving seven classes. The first class
extends from 7 minutes up to, but not including, 8minutes (7 ≤ t <8). Sensible scale
divisions on the x-axis are at 7, 8, 9 etc. and so the class boundaries correspond to scale
divisions. For example, the boundary between the 3rd and 4th classes is at 10minutes, the
upper boundary for the 3rd class and the lower boundary for the 4th class.
The question is on the next page.
Histogram - Times for a Race
0
1
2
3
4
5
6
6
7
8
9
10
11
12
13
14
15
Time (minutes)
Upper boundary of class 9≤t<10