| Page |
|
© Peter Broadfoot 2008
Histograms
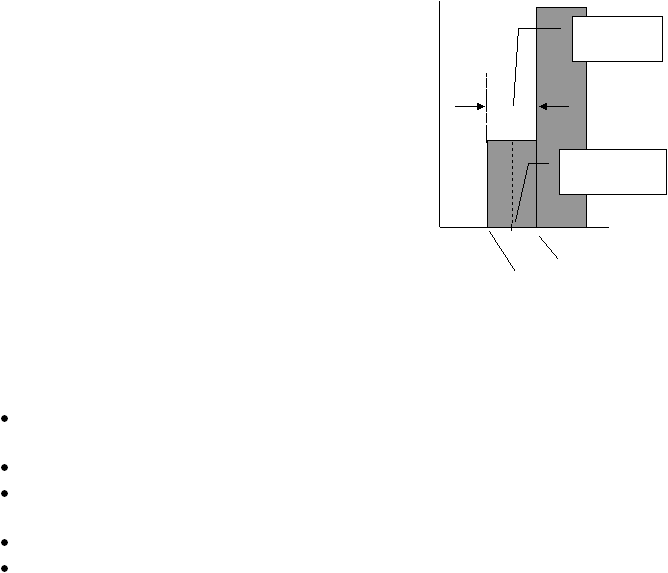
This mid-point
value is 2
upper limit
(boundary) = 3
lower limit
(boundary) = 1
Class width
= 2
Class and Class Interval
Using 1mile group widths will give 12 groups for the total range of data, from 1 to 13miles.
You don’t have to use a 1mile width. In the histogram for the employees on page 4, the
group width was 2miles. The first group starts at 1mile and stretches to 3miles. This gives
altogether 6 groups. A sensible number of groups is no less than 5 and no more than about
15 groups.
The groups are called classes. The range of values
included within a group is called the class interval. The
class interval for the first class is from 1mile up to, but
not including, 3miles. 2.9miles is in the first class but 3
miles is in the next class, from 3 up to, but not including,
5miles.
The class limits are the boundaries of a class. The lower
class limit of the 1 to 3miles class is 1mile. The upper
class limit of that class is 3miles. The class width is the
difference between the upper and lower boundaries: in
this case 3–1 = 2miles. The mid-point is the middle
value. The mid-point of the 1st class is 2miles.
In this section you have learned these terms used to describe groups:
class, class width, class interval, lower and upper class limits, class boundary, mid-point.
In the example histogram on ‘Distance Travelled to Work’, the data are grouped into 6
classes.
The class limits coincide with the class boundaries. You may see examples where
the limits are inside the boundaries.
The class width is 2miles, the difference between the upper and lower boundaries.
The 2nd class interval is 3miles up to, but not including 5miles and its mid-point (the
mean of 3 and 5) is 4miles.
The upper boundary of the 2nd group is 5miles.
In GCSE Maths questions, the class boundary values are normally integers, such as
10, 20, 30 etc. This makes the question easier to understand. The boundaries then
coincide with divisions on the x-axis, which could be 5, 10, 15, 20 etc. This is
different from a bar chart, where the bars are centred on the labels on the x-axis.
Symbol for the Class Interval
In mathematics, the class interval is written using the inequality symbols < and ≤.
The < means less than as in x < 3 (x is less than 3).
The ≤ means less than or equal to as in 1≤ x (1 is less than or equal to x).
The class interval for distance d in the group “from 1 up to, but not including 3” is written:
1 ≤ d < 3
It means that d can take any value between 1mile and 3miles, but not including 3. If d=2.9
then d is less than 3 and so it belongs in the first class. If d=3 it belongs in the next class.