| Page |
|
© Peter Broadfoot 2008
Histograms
Appendices
Appendix A – Explanation of Frequency Density
We’ll use a wine collection as an example. The wine is grouped according to age into 2year
classes (width w=2years). The 10 to 12 year old class contains 8 bottles (f=8). There could
be 3 bottles between 10 and 11years old, and 5 bottles between 11 and 12years old. The
frequency density is fd = f/w = 8/2 = 4 per year. What does that mean? The ‘4 per year’
means that the average number of bottles per year, in the 10-12years class, is 4. In this
example, there are actually 4 bottles in each of those years. Now, imagine that we initially
grouped into 1year class widths. The 10-12years class would be divided into two classes,
from 10-11years and from 11-12years, with 4 bottles in each.
To understand frequency density, we’ll look at the effect of re-grouping those two, 1year
classes into the single 10-12years class. The 1st histogram below shows just the 10-11years
class containing 4 bottles. Should the y-axis be frequency or frequency density?
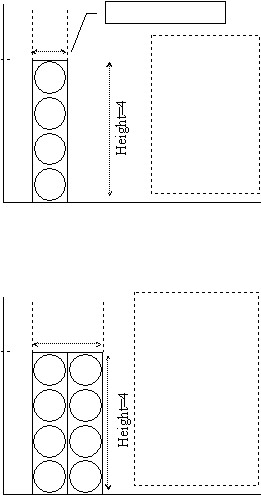
It helps to think of the bar as a tall box. The stack of
circles is a pictogram of bottles inside the box. The
box is like a wine rack. It contains 4 bottles (f=4) and
so the height of the box is 4. The class width is 1year,
and so the frequency density is fd=f/w=4/1=4 per year.
Therefore, for a 1year width, the frequency density
equals the frequency and so the y-axis could be
labelled frequency or frequency density. The area of
the box is the height multiplied by width = 4×1 = 4.
The 2nd histogram shows the 10-11years class and the next one along, the 11-12years class.
There are 4 bottles in each box and so the height of both boxes is 4. There are 8 bottles in
total. Suppose we now re-group the data into the 10-12years class that we started with.
You can think of this diagram in two ways. Either it
shows the two narrow boxes (classes), each width w =
1, or it shows a single, wide box (class), width w = 2.
The frequency for the wide class is f = 4+4 = 8. If the
box’s height is the frequency, you can see that the wide
box would have to be 8 bottles high. But the 8 bottles
do not stack vertically in the wide box – they stand in
two stacks of 4, side by side, to fill the box’s width.
The area A = 4×2 = 8. The height is A/w = 8/2 = 4.
The diagram shows that the area of a bar is the frequency. The area of the 1year width is
h×w = 4×1 = 4. For the 2year width, the area equals 4×2 = 8. When you combine the two
classes, the areas add. Clearly, the area equals the frequency. The height of a bar is not
the frequency. The height (h = A/w = 8/2 = 4) equals the frequency density.
Therefore a histogram is drawn with bars to represent the classes. The width of a bar equals
the class width. The area of the bar is the class frequency. The variable on the y-axis (the
height of the bar) is the area divided by width, called the class frequency density.
w=1
4
There are four
data items in the
box (f=4). The fd
is f/w:
f/w = 4/1 = 4
Note: the area of
the box is the
frequency:
Area = 4×1 = 4
A bar is like a box
4
w=2
The combined frequ-
ency of both boxes is
f=4+4=8. The width
is w=2. The fd is f/w
= 8/2 = 4
Therefore the fd is
the same for the wide
2year class.
Note: the area of the
box is the frequency:
Area = 4×2 = 8