| Page |
|
© Peter Broadfoot 2008
Histograms
The Area of a Histogram
Suppose that you need to read frequencies from a histogram. GCSE exam questions
routinely ask this. The method uses the area of the histogram. That requires some
explanation. The height of a bar on a histogram is the frequency density, and not the
frequency. How then do we represent frequency on a histogram? The answer is that the
frequency is the area of the bar. The area of all the bars equals the total amount of data.
height of bar equals frequency density
area of bar equals frequency
This is confusing if you are not familiar with ‘area under a graph’. If you’ve met speed-
time graphs you know that the ‘area’ equals the ‘distance travelled’. If so, the good news is
that histograms use area and that the maths is similar. Most students, however, meeting
histograms for the first time, probably have no experience of the use of area under a graph.
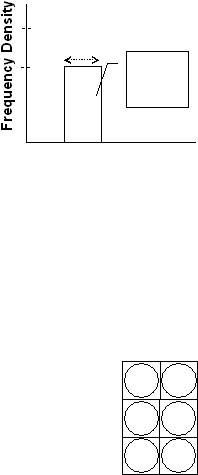
Here’s a simple example to explain the area. We’ll look at just one bar from a histogram.
We’ll call it a rectangle because rectangles have an area. The frequency f is 8, the class
width is 2. The frequency density is fd = f/w = 8/2 = 4.
The height h of the rectangle is the frequency density. h=4.
Area equals length multiplied by width. In this case, that’s
height multiplied by width. The area A = h×w = 4×2 = 8.
Therefore, the area of the rectangle equals the frequency.
This result follows directly from the definition of fd. The
height of the rectangle is f divided by w (h=f/w), therefore the
frequency is the height multiplied by w (f = h×w = area).
We could reverse the logic. We could start by defining a histogram as a frequency diagram
in which the frequency is represented by the area of the bar. It then follows that the height
of the bar equals the frequency density (h = A/w = f/w =fd). If that definition is used in an
introduction it would be very difficult to see the link between a bar chart and a histogram.
With the advantage of hindsight, however, that alternative definition may be preferable.
If you are used to calculating area for real things, such as the area of tiles, it may seem odd
that an area equals a frequency. Remember, though, that the rectangle just represents a
class on a histogram. It is not a real object. It has ‘height’ and ‘width’, but those are not
real lengths, measured in metres. The ‘area’ is not a real area.
The area of a rectangle on a histogram is the frequency, which is a count of the
number of data items in the class. This example shows a more familiar example
of how a count of items can be equated to an area. The items are canned drinks.
This rectangle measures 3cm by 2cm. The area = 3×2 = 6cm^2. The rectangle
could represent a box for storing canned drinks. There are 3×2 = 6 cans.
Clearly the number of cans behaves like an area – but the number doesn’t actually equal an
area. You wouldn’t say that the number of cans in the box is 6cm^2. Each of the 1cm
squares simply represents 1 can.
The section Exam Questions on Frequency Density shows how frequency, frequency
density and the area of a histogram are used in exam calculations.
See Appendix A, Explanation of Frequency Density, for a visual explanation of frequency
density, based on the idea of a histogram bar as a box that holds the data.
4
6
w=2
The area
= h×w
= 4×2 = 8