| Page |
|
© Peter Broadfoot 2008
Histograms
Frequency Density
Definition
In the simplified histograms so far, the height of a bar on a histogram equals the frequency.
That is OK if the class width equals one. If it is not equal to one then there is a problem
(explained below). The solution is to divide the frequency by the class width, to calculate
what is called the frequency density (fd). The equation for frequency density is:
frequency density fd =
frequency f
width w
For example, if the frequency is 8 and the width is 2kg, the frequency density is 8 divided
by 2 (8/2) = 4 per kg. Don’t be ‘put off’ by the “per kg”. The data could be the weights of
sacks of flour that are grouped into classes. The class width is 2kg. There may be 8 sacks
that weigh between 10 and 12 kg. The frequency for that class is 8 sacks in the 2kg width.
The frequency density is 8/2 = 4 sacks per kg width in the 10 to 12 kg class.
The Problem with Frequency
Frequency density is better than frequency. Using frequency density, you can make
comparisons between data that is grouped into different class widths. The idea is similar to
the unit price of a product. Cat biscuits are sold in 2kg bags – nothing to do with the sacks
of flour. To compare the price of the biscuits with other brands, you calculate the price per
unit weight (per kg). Divide the price by the weight to give the price per kg.
Another similar example is weight (or mass) per unit volume, called the density of a
material. A comparison of the ‘heaviness’ of materials is possible using density, because
you are comparing the weights of equal volumes. In order to compare histograms, you use
frequency density. Frequency density is like a standardised frequency that allows you to
compare data that is grouped into different class widths.
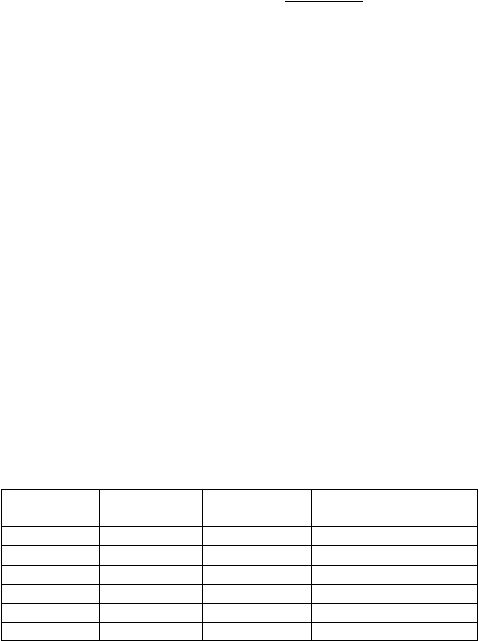
For an example, we’ll use the ‘Distance Travelled to Work’ grouped data that we used in
the histogram on page 4. The classes are all the same width (w = 2miles)
Distance d
(miles)
Frequency
f
Class Width
w (miles)
Frequency Density
fd (per mile)
1≤d<3
60
2
30
3≤d<5
150
2
75
5≤d<7
120
2
60
7≤d<9
90
2
45
9≤d<11
30
2
15
11≤d<13
12
2
6
To calculate the frequency density, divide the frequency by the class width. For the 60
people who travel between 1 and 3miles to work, the frequency density = 60/2miles = 30
people per mile. That means that, on average, 30 employees live between 1 and 2miles and
30 live between 2 and 3miles from their work.
On page 4 the histogram was drawn using the frequency on the y-axis, as shown on the next
page. The height of each bar equals the frequency. That works for a bar chart, but you will
see, in the next section, that it does not work for a histogram.